Tuesday, January 8, 2019
Tuesday, August 7, 2018
Why Is Economic Data Important To A Stock Market by Pauline Yong
Inflation Rate
Interest Rate
Interest Rate
Gross Domestic Product (GDP)
Unemployment Rate
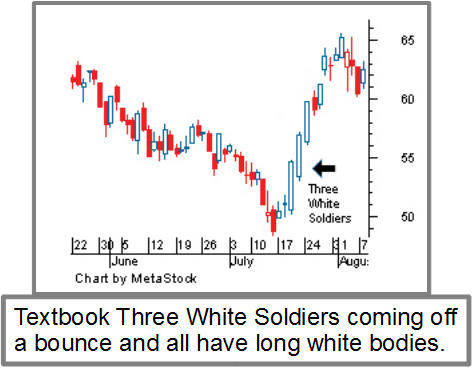
CANDLESTICK PATTERN: THREE WHITE SOLDIERS
Three white soldiers is a candlestick chart pattern in the financial markets. It unfolds across three trading sessions and suggests a strong price reversal from a bear market to a bull market. The pattern consists of three long candlesticks that trend upward like a staircase; each should open above the previous day's open, ideally in the middle price range of that previous day. Each candlestick should also close progressively upward to establish a new near-term high.[1]
The three white soldiers help to confirm that a bear market has ended and market sentiment has turned positive. In Candlestick Charting Explained, technical analyst Gregory L. Morris says "This type of price action is very bullish and should never be ignored."[2]
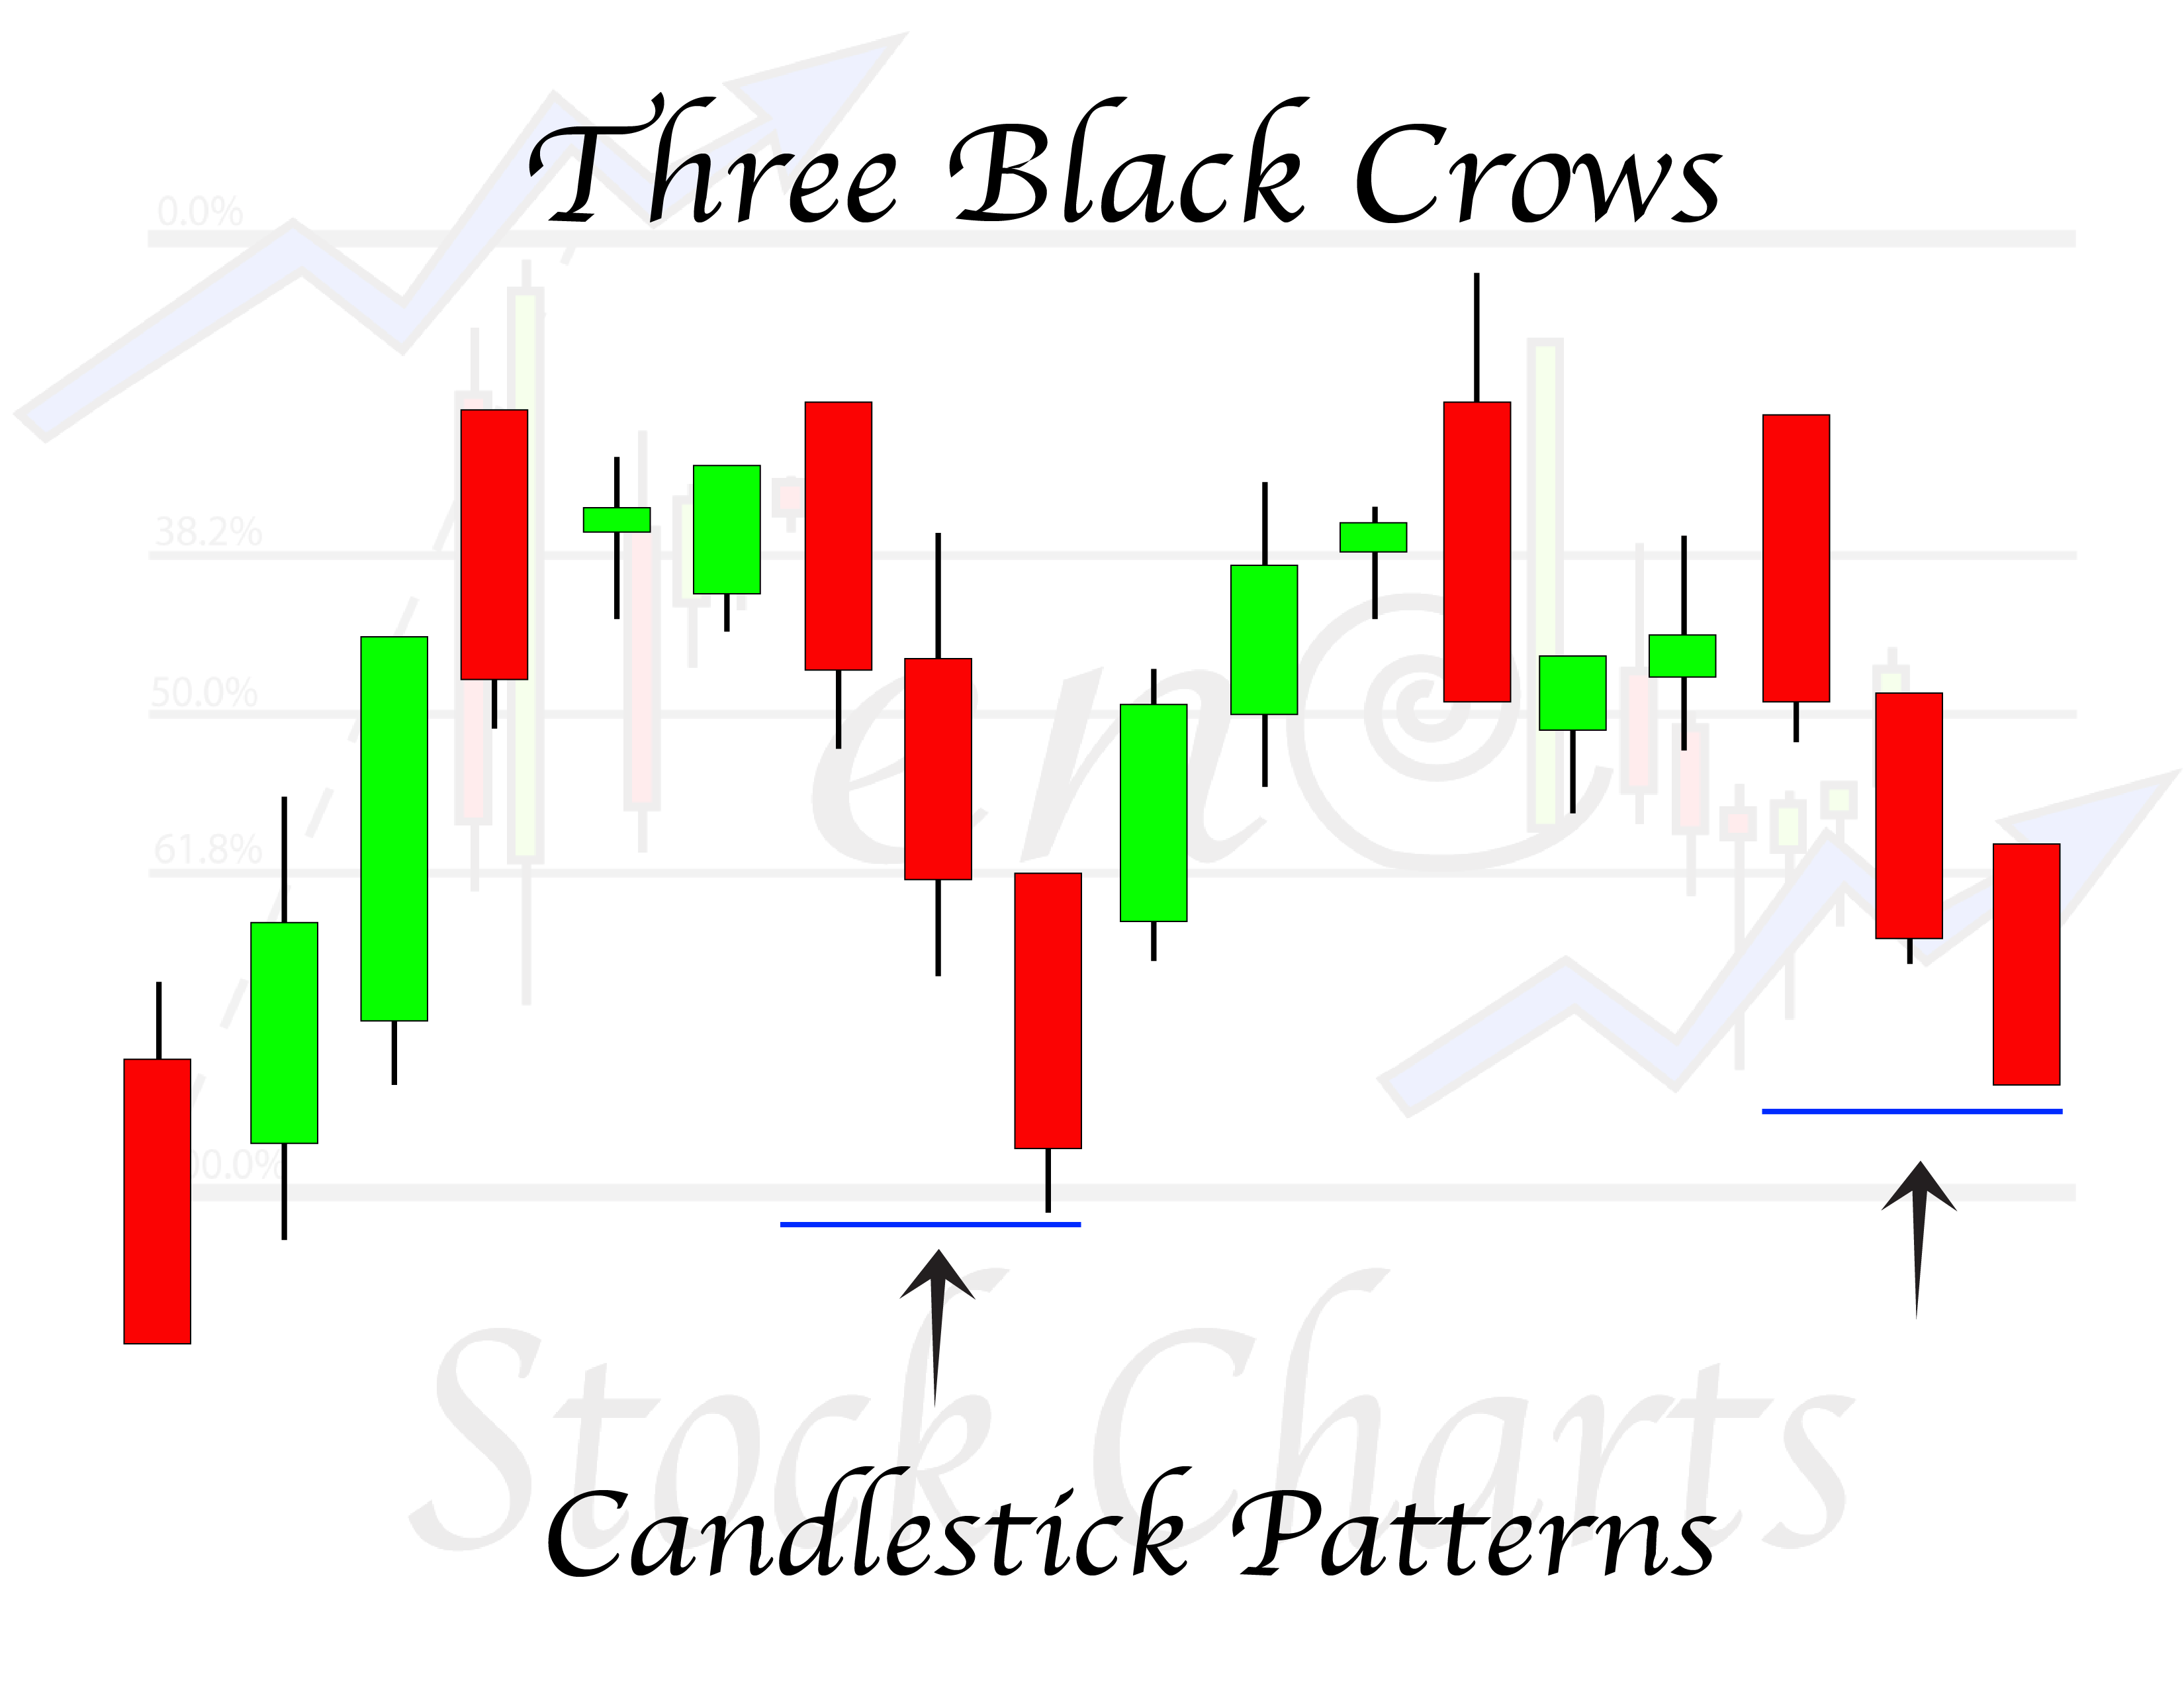
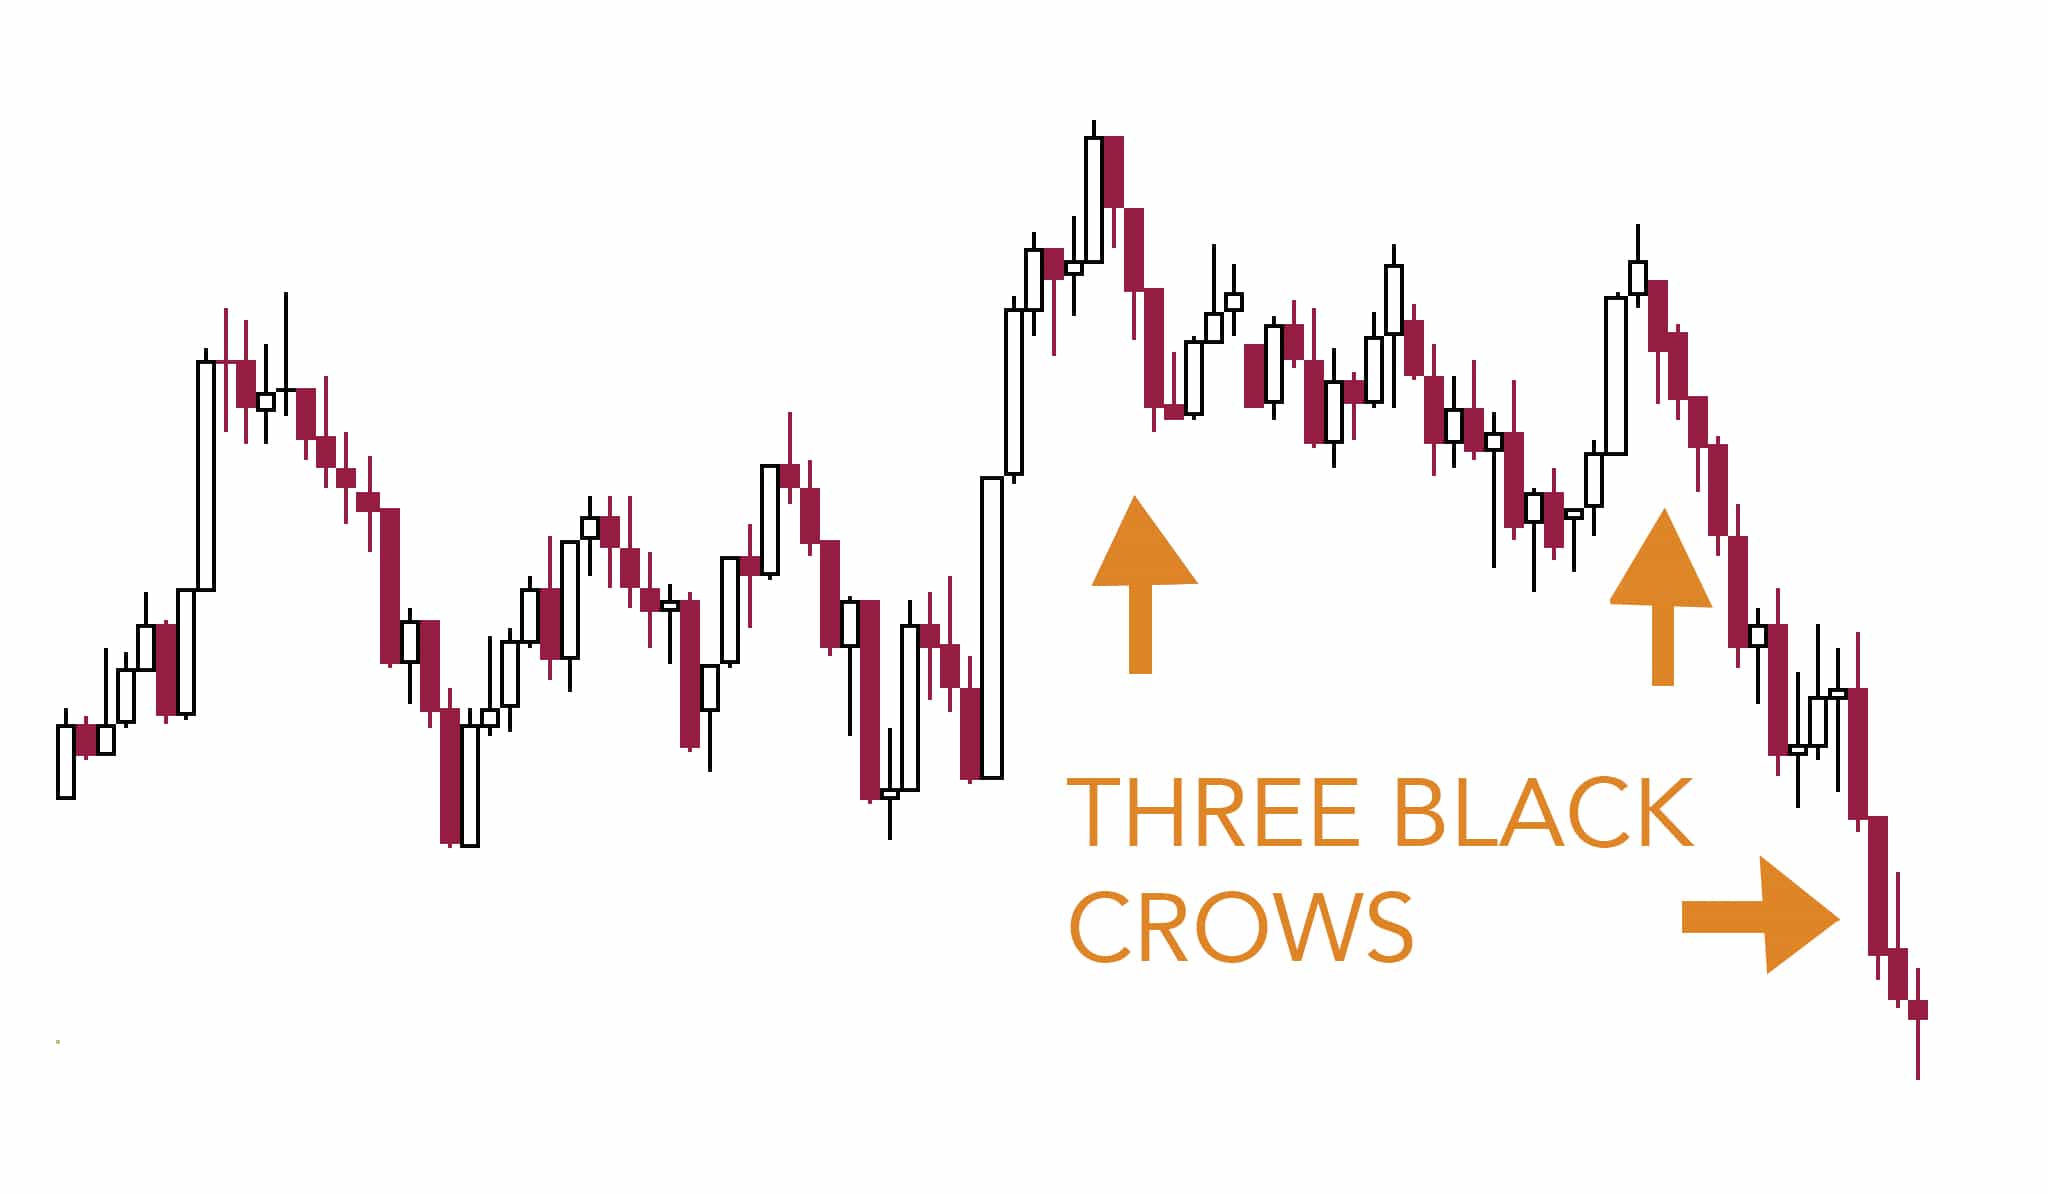
This candlestick pattern has an opposite known as the Three Black Crows, which shares the same attributes in reverse.

The Three White Soldiers is a bullish pattern which forms after a strong downtrend or a prolonged consolidation. The appearance of this pattern, suggests that participation in the stock is increasing in a sustained manner, leading to a rise in price.

Now, if we look at the chart below, and correspondingly study the momentum indicator: RSI (Relative Strength Index), we see that a very interesting phenomenon has surfaced.
Earlier, within the consolidation, we saw that the price was resisting at the level of 880 whereas RSI turned down from the 50 level. But, this time, though the price is still near the level of 880, RSI has already broken above the 50 level and crossed over the previous highs. Adding on to this, currently, RSI is marking the 64 level, which is the ‘bull trend’-range.

Therefore, from the combined study of the candlestick chart of HCLTECH and the momentum indicator RSI, we can conclude that there has been an evident shift in the sentiments and the level of 880 is the resistance which the stock needs to overcome to really prove the usefulness of the candlestick pattern – Three White Soldiers, and the RSI ‘Range Break’.


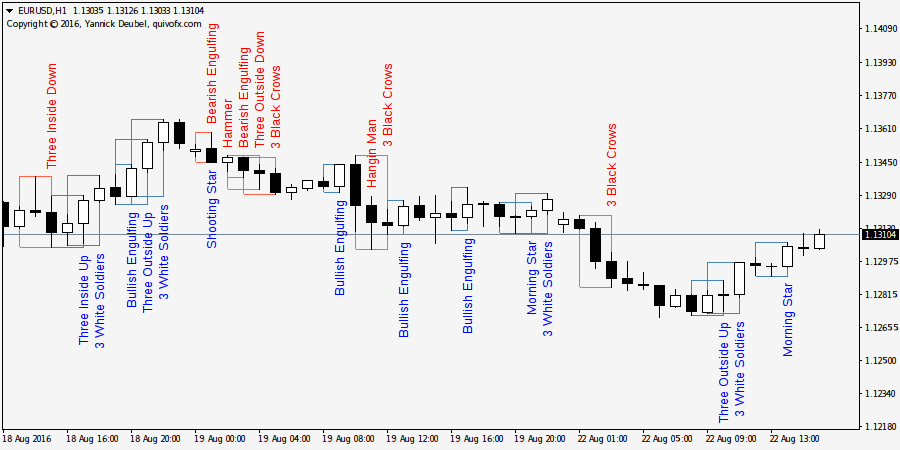


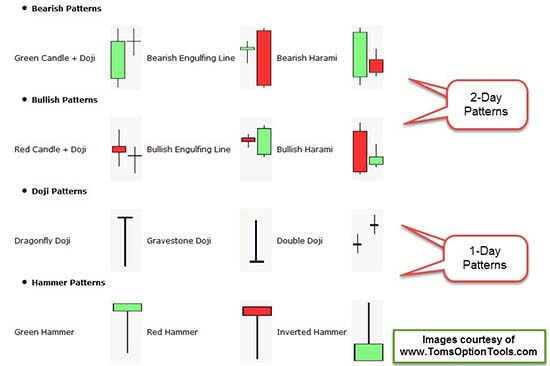
CANDLESTICK PATTERNS
The candle patterns listed below comprise the library that is used to identify candlestick signals. The number in parentheses at the end of each name represents the number of candles that are used to define that particular pattern. The bullish and bearish patterns are divided into two groups signifying either reversal or continuation patterns.
Bullish Reversals
Long White Body (1)
Hammer (1)
Inverted Hammer (1)
Belt Hold (1)
Engulfing Pattern (2)
Harami (2)
Harami Cross (2)
Piercing Line (2)
Doji Star (2)
Meeting Lines (2)
Three White Soldiers (3)
Morning Star (3)
Morning Doji Star (3)
Abandoned Baby (3)
Tri-Star (3)
Breakaway (5)
Three Inside Up (3)
Three Outside Up (3)
Kicking (2)
Unique Three Rivers Bottom (3)
Three Stars in the South (3)
Concealing Swallow (4)
Stick Sandwich (3)
Homing Pigeon (2)
Ladder Bottom (5)
Matching Low (2)
Bullish Continuation
Separating Lines (2)
Rising Three Methods (5)
Upside Tasuki Gap (3)
Side by Side White Lines (3)
Three Line Strike (4)
Upside Gap Three Methods (3)
On Neck Line (2)
In Neck Line (2)
Bearish Reversals
Long Black Body (1)
Hanging Man (1)
Shooting Star (1)
Belt Hold (1)
Engulfing Pattern (2)
Harami (2)
Harami Cross (2)
Dark Cloud Cover (2)
Doji Star (2)
Meeting Lines (2)
Three Black Crows (3)
Evening Star (3)
Evening Doji Star (3)
Abandoned Baby (3)
Tri-Star (3)
Breakaway (5)
Three Inside Down (3)
Three Outside Down (3)
Kicking (2)
Latter Top (5)
Matching High (2)
Upside Gap Two Crows (3)
Identical Three Crows (3)
Deliberation (3)
Advance Block (3)
Two Crows (3)
Bearish Continuation
Separating Lines (2)
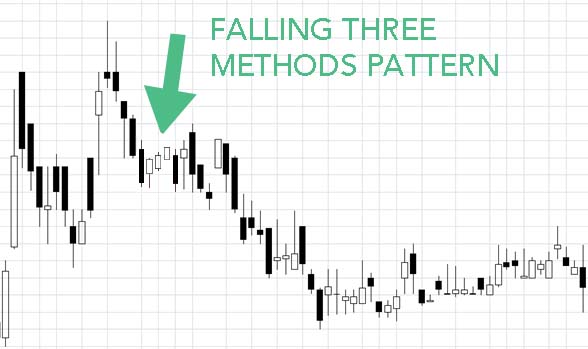
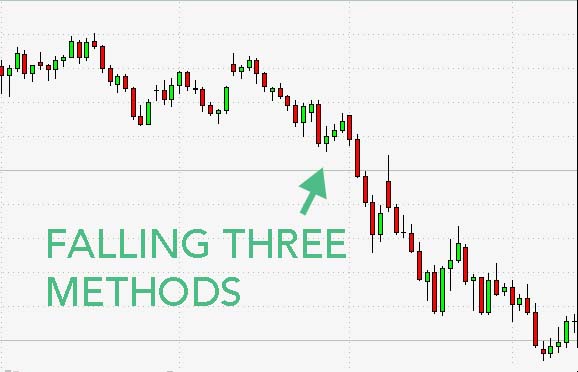
Falling Three Methods (5)
Downside Tasuki Gap (3)
Side by Side White Lines (3)
Three Line Strike (4)
Downside Gap Three Methods (3)
On Neck Line (2)
In Neck Line (2)


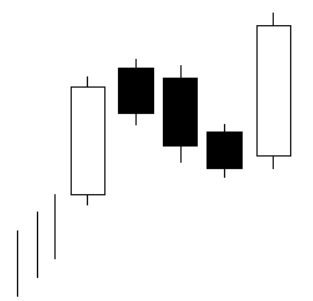
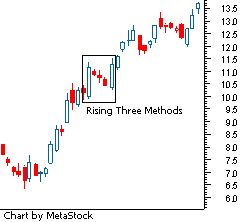
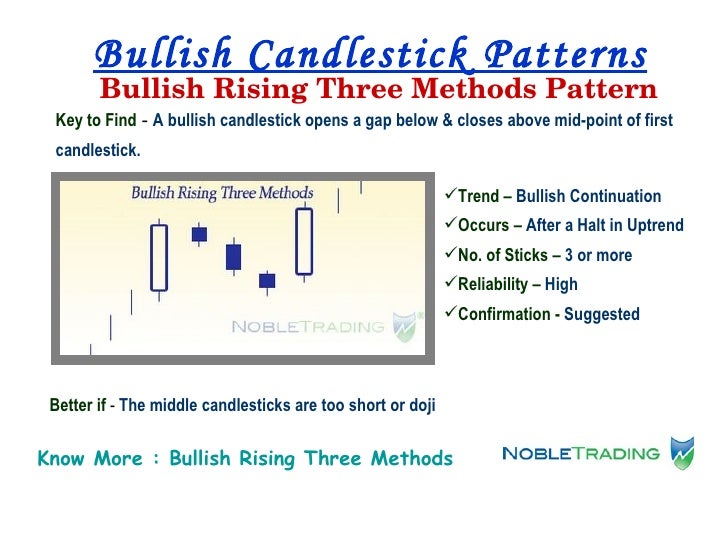
CANDLESTICK PATTERN: CONTINUATION PATTERN: Rising Three Methods
Rising and Falling Three Methods:
The Rising Three Methods continuation candle pattern is the bullish counterpart to this duo and will be the subject of this scenario building. A bullish continuation pattern can only occur in an uptrend and a bearish continuation pattern can only occur in a downtrend. This restates the required relationship to the trend that is so necessary in candle pattern analysis.
The first day of the Rising Three Methods pattern is a long white day which fully supports the uptrending market. However, over the course of the next three trading periods, small body days occur which, as a group, trend downward. They all remain within the range of the first day's long white body and at least two of these three small-bodied days have black bodies. This period of time when the market appears to have gone nowhere is considered by the Japanese as a "period of rest." On the fifth day of this pattern, another long white day develops which closes at a new high. Prices have finally broken out of the short trading range and the uptrend will continue.
A five day pattern such as the Rising Three Methods requires a lot of detail in its definition. The above scenario is the perfect example of the Rising Three Methods pattern. Flexibility can be applied with some success and this only comes with experience. For example, the three small reaction days could remain within the first day's high-low range instead of the body's range. The small reaction days do not always have to be predominantly black. And finally, the concept of the "period of rest" could be expanded to include more than three reaction days. Don't ignore the Rising and Falling Three Methods pattern; it can give you a feeling of comfort when worrying about protecting profits in a trade.


MORE:


Subscribe to:
Comments (Atom)